What’s a SWOT analysis and how do I do that?

SWOT
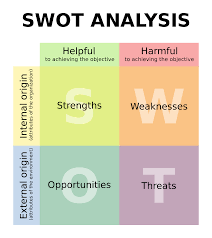
Are you developing a new plan, strategy, or service?  For any of these (and for charting the course of your organization), a critical step that you do not want to miss is the development of a Strengths-Weaknesses-Opportunities-Threats (SWOT) analysis.

It is best done in collaboration with your team; and in order to do a good job, you’ll need to do some homework.

The best template tool I’ve found for this purpose is offered as a free download at DIY (Development Impact and You). And by the way, DIY offers a wide array of hugely valuable templates and tools, with simple guidelines on using them. If you are embarked on strategic planning or service design, bookmark this site.

Be totally honest when you do a SWOT analysis, because fudging negatives and overemphasizing positives will not help you.  Done right, the exercise can help you to surface some high potential activities or design elements that you very well might not have thought about otherwise.

DIY has a good explanation at the link provided about how to use the SWOT.  Don’t choose too many items to put in each box – I’ve found that it’s helpful to let the group brainstorm as many as they like, and then narrow the selection down to the top 5-6 at most.


Instagram posts faster growth rates than Facebook and Twitter

instagramAccording to an article by the Content Marketing Institute, Instagram use grew faster than other leading social media channels from 2012-2014.  The Pew Research Center offers great research on this, along with insights into the use of technology and social media by US teens. Nearly 75% of teens either have or have access to a smartphone, and over 90% go online daily; with more than half going online several times a day.

While I hear from colleagues in education that students frequently report that “they don’t really use Facebook anymore” (because it has lost it’s cool factor) – these reports don’t agree with the research. According to Pew, 71% of all teens report using Facebook, and it remains the leading social media channel for this group.

You can find the original Pew Research report here.

The increasing popularity of Instagram has also led to an interesting development among social marketers who use images as a central part of their strategy. Instagram excels in user generated content, and the majority of images found there are far from the perfectly stylized, high quality professional photographs that companies and organizations typically create and use for marketing.

As a result, organizations and companies are investing more time in the creation of art and photographic images with image errors and imperfections. These are being posted in  content campaigns in an increasing and intentional effort to make these images look like user generated content – authentic.

2016 Research into Top Channels for Content Marketers

The Content Marketing Institute offers wonderful annual benchmarketing and research reports on their website.

researchTake some time to browse through these! Whether your focus is nonprofit marketing, B2B, or B2C, you’ll get some useful tips to live by along with a good idea of where you are compared to similar organizations.

For instance, the top 5 social channels that are being used this year by both B2B and B2C marketers are the same leading outlets: Facebook, Twitter, LinkedIn, YouTube, and Google+. LinkedIn is at the top of the list for B2B marketers, while Facebook still takes first place for B2C.

In 6th place for B2B marketers is Slideshare, while B2C marketers favor Instagram in 6th place.

In both cases, Instagram has seen terrific growth – its use is up 21 – 27% over last year.

While Google+ is widely used among both crowds, most think it is not effective. What is viewed as highly effective? The continuing stand-bys: LinkedIn, Facebook, Twitter, and YouTube.

Nothing like a Content Infographic

You could create a big spreadsheet to plan your content, or write out your strategy for using different content types, what your goals are for each, target audiences, and channels. I’ve done that more than once, and these are great documents for those with the time to wade through them.  But if you want your content strategy to be understood across your organization, by all those staff members that might be contributing – and if you want to keep the strategy and mix at the top of your own mind – than think about creating a more simple visual map to help you plan and monitor your content activities.

The Content Marketing Institute offers a great article (How to Use Visual Maps for a Balanced Content Marketing Strategy), with some examples of how you might map your content visually.  I love a good infographic, and some of the ideas they reference with examples from Smart Insights are great places to start. Here’s one:

smart-insights-content-marketing-template-image 1


Why wait to adopt new social media channels?

Keep the 5 Step “Hype” Cycle in mind to make your adoption of new channels more intentional.

Gartner, Inc. explains their research findings into the adoption of emerging technologies in clear phases in this article. Here’s a quick look:


Gartner-Hype-Cycle
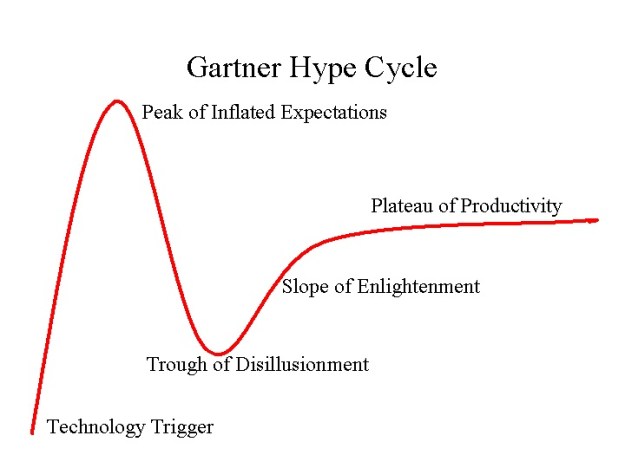
Applied to your organization’s adoption of new social media, you will need to keep in mind how risk-friendly or risk-averse you want to be in seeking out new types of channels. While emerging social media tools frequently look free at the outset (no out of pocket costs), the downside cost of investing the time necessary to identify, understand, and populate new social media channels can be prohibitive. Depending on your resources for communication and content creation, you may be an organization that wants to take a wait and see stance until others have made it through the disillusionment phase and you can begin to see successful applications discovered through enlightenment.

But my audience is all over the new channel!

Never forget:  I’ve talked more than once about remembering to regularly research your target audiences. Where are they, and where do they congregate? Matching that data up with a good understanding of the cycle of adoption for your audiences can also help you to weather the inflated expectations phase without jumping prematurely into what looks like the newest biggest thing; only to find your audience members abandoning your channel in droves.

The 411 of social media posts

The 4-1-1 rule relates to best practices in using Twitter for your content marketing efforts; but it holds up well for any social media outlet that you’ll use on behalf of your organization. When you are planning and scheduling tweets, posts, or other types of content offerings online, this is a quick way to keep tabs on the kind of value you’re providing.

It goes like this:

For every one tweet, post, or piece of content you create online that is “self-serving” (that is, really about marketing you and your organization), you should create 4 that are new pieces of just-plain-useful, value added content, and 1 that is a retweet or repost of something that your audience will find valuable.

There is a great infographic about this posted online at AdWeek’s Social Times.

I offer a quick look at it here, but you can check it out at the source with the link above.

4-1-1 rule of tweeting


Brand ambassadors are the voice of your brand

voice balloonYour brand voice will set the tone for all of your communications; but is often overlooked by organizations when they develop messaging and redesign their brand.  As a result, depending on who the author of any given communication on your behalf may be, your communications can sound haphazard and jarring to your audiences – creating inconsistencies that are confusing and even uncomfortable.

A good brand guide should not only address basics like color palette, elevator speech, tag lines, logos, and visual identity. Your brand guide needs to cover the voice and style in which your organization addresses the audience.  Some elements of your voice might differ depending on the channel – for instance, your voice on Facebook might be more informal and fun than your voice on your website, a blog, or your content resources.

Nevertheless, your audience should always be aware that it is your organization talking.

A consistent brand voice requires you to educate all of those in your organization. Any member of your staff can be a brand ambassador, but only if they know about the voice and the messages that are important to you.

Check out the Cleveland Clinic branding site.

Cleveland Clinic goes beyond the basic brand guidelines for their staff. Their OnBrand website helps to educate their brand ambassadors about their history, mission, and “pride points” – helping staff to visualize what kinds of stories will support the organization best when shared with customers.

OnBrand does more than just act as a resource for staff. Cleveland Clinic’s brand team goes proactive, with educational pushes about their branding messages and elements, on their intranet.


How do you know if your video content is engaging?

videoWhat kinds of metrics will give you a quick feel for how interesting and engaging your content is to viewers?

A common mistake is to accept the number of views for your online videos as a clear indication of success. It’s quite possible for visitors to click on your video by mistake, have it automatically open when shared on Facebook, or check it out only to close it again within seconds.  These views can inflate your statistics without proving out the actual value of your video.

Similarly, the number of shares may not tell you what you’d like to know. There are any number of reasons that viewers may share your video (and not all are positive).

For a more reliable indicator of engagement and value, think about focusing on a metric like watch time.  If you launch your videos on your YouTube channel, you can easily run a watch time report on your content assets.  YouTube offers fairly straightforward instructions on running a report online.

Think about how many viewers are watching your videos for 30 seconds or more. Better still, how many are watching the videos through to the end?  Where in your video is the biggest dropoff occurring?  By paying attention to your analytics with regular reporting and assessment, you may be able to identify trends that will help you to improve on your scripting and video development, helping you to capture attention quickly and keep it through to the end.

So What? Writing about benefits v. features

Image of Post it NotesAs you develop your branding messages and work from that to create more specific messages about what you do, always keep in mind that you are addressing your customers – and that they are looking for a solution to a problem.

While it’s important when designing a service to understand how the features of your service make it (and you) distinctive), be careful not to leave your marketing message there.  It’s only the first step in communicating effectively.

Features describe the content of the service or product: what does it do, what does it have, how does it work?

Features are important to the customers who will choose you from an array of options. Anyone who has referred to Consumer Reports before buying a car or appliance knows that we all love comparison charts and checklists – and those are all about features.  But the reason that your customers are looking for a set of features is to solve a problem. Even in business, that problem is likely to have a business component and a personal component.  The more you know about both, the more you can resonate with your audience.

Benefits are what your services or products will help your prospect to do, They describe what the customer wants to accomplish and how they will help to get there. This is the business or work goal that you designed for.

Best of all is when you understand your customer well enough to go deep, and speak to their personal motivation in the matter. People make decisions and selections in their professional lives all the time based on emotional and personal responses, justified with logical processes. Understanding what they are really feeling helps you to describe not just a benefit, but a really good benefit.

Good benefits address your customer’s motivation and personal investment in their project or goal, and identify meaning on a more emotional level.

I love Post it® Notes, so they’ll serve as a good example of features v. benefits here.

Feature:  Post it® Notes are designed in an array of colors and sizes that you can mix and match; and you can stick them in one place and then easily move them around when you change your mind about an idea.

Benefit: When I am designing a service, Post it® Notes allow me to work on ideas that have many parts and levels and capture evolving thought. They solve the problem of how to brainstorm together with a group without confusion or mess.

Good Benefit: Post it® Notes are an excellent collaboration tool that help me to lead while ensuring that I’m including all voices in the group in the process of creation, and discover ideas that I might not have otherwise surfaced.

Finally, when you are writing about your brand, product, or service, be mindful about going the extra mile to distinguish between serving up a list of features and really conveying what your offering will do for the customer; pragmatically and emotionally. As yourself:

  • So what? (ask it multiple times, not just once)
  • Why do they want that feature?
  • What are they trying to do that will make them choose this?
  • How do they want to feel about their project or goal – what are their personal motivations?
  • How will your offering create a positive emotional reaction for your customers?


Blogging isn’t easy

For those of you who have blogs or are entertaining the notion, you are likely to encounter the age-old challenge that we all have.  There is never enough time.

For any social media outlet that you manage, it’s absolutely essential to create an editorial calendar.  Decide the frequency with which you’d like to post, the type of posts you’ll develop, and who will author the post if you have multiple authors.

Without a plan, you’ll quickly find yourself looking at huge long “posting gaps”.

There’s a great infographic about this developed by LinkedIn Marketing Solutions.  It offers ideas about the different types of content you might offer, and encourages you to mix it up for a well-balanced content approach. I’ve pinned it to my office wall, in the hope that it will remind me to keep the faucet turned on and the content flowing – and I hope it will inspire you as well. Just click on the thumbnail to open the graphic, and have fun!

Well-balanced blog infographic from LinkedIn Marketing

From LinkedIn Marketing